Features


Dynamical Systems

Visualize and analyze attractor dynamics of complex dynamical systems like neural networks.

Biological / Medical Data

Use implemented methods to understand of biological and medical multiple source signals.

Financial Data

Observe financial data changing over time.
Identify trends and cyclical patterns occurring in stock prices.

Dimensionality Reduction

Reduce data dimensionality using Fuzzy Symbolic Dynamics, Multidimensional Scaling and Principal Component Analysis.

Recurrence Analysis

Find recurrent behavior in collected data using Recurrence Plots and Prototype Distance Plots.

Short- & Long-Term Behavior

Analyze short- and long-term behavior of your systems, including specific system states reached during evolution process.

Segmentation

Use extended recursive entropic segmentation scheme for applications to biological sequences and other time series.

Clusterization

Analyze the similarity of examined subjects using correlation based functions and pair correlation approach.

Customizable

Adjust parameters of implemented techniques to experience the best results for your individual cases.

Examples


Respiratory Rhythm Generator
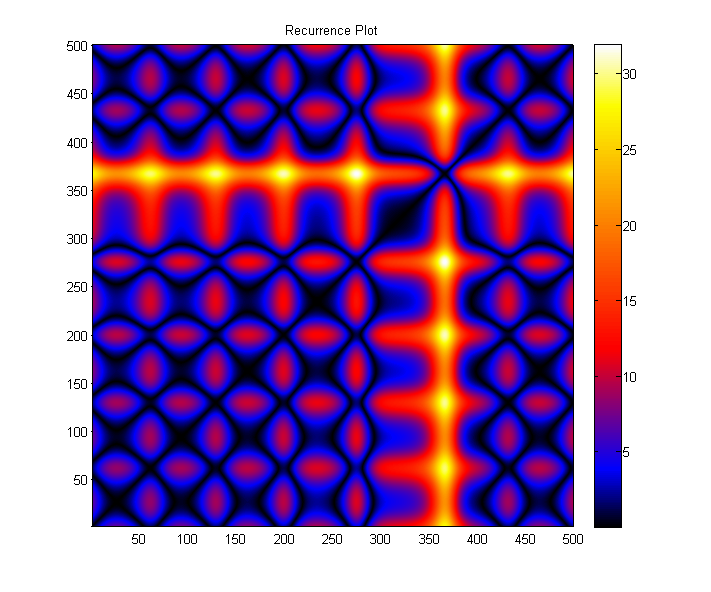
Lorenz Attractor

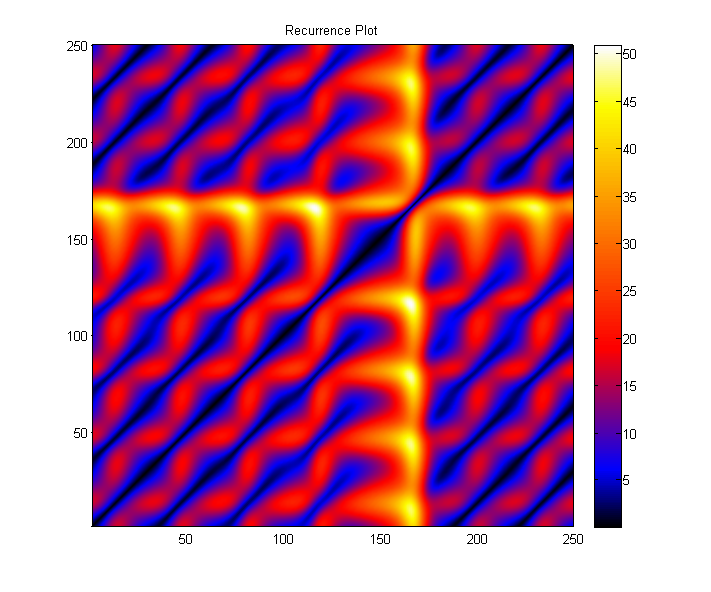
Orbits swap in Lorenz Attractor

Dow Jones Stock Index

Cyclic Movements Model

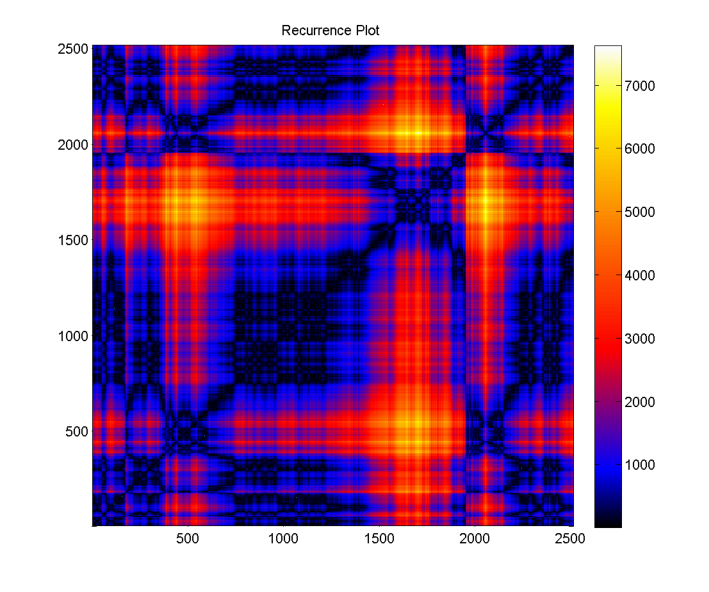
Long simulation of Dyslexia Model

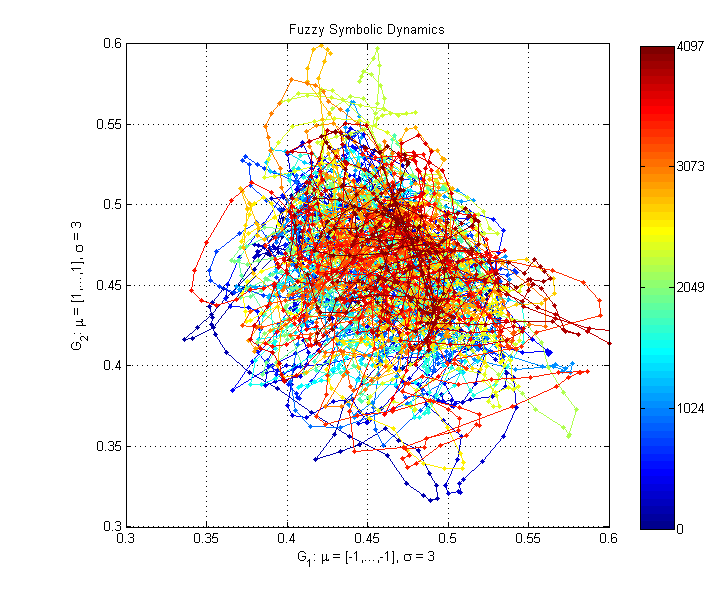
Model of Word Reading and Dyslexia
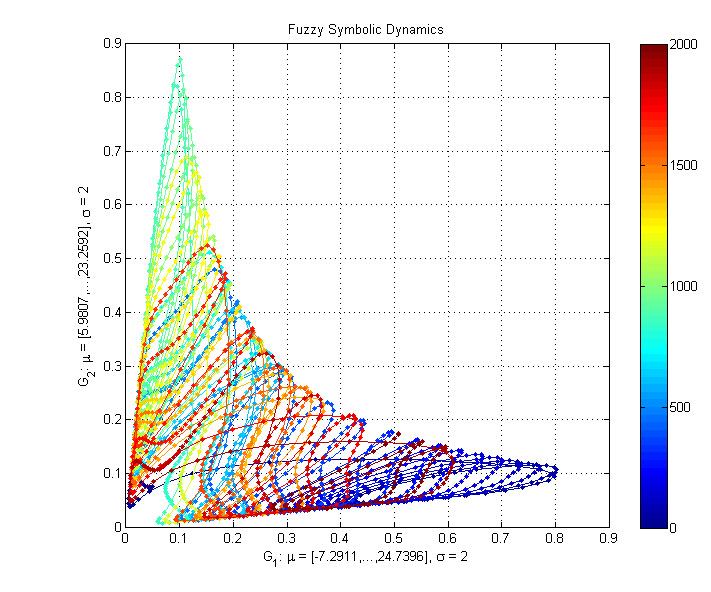
Lorenz Attractor

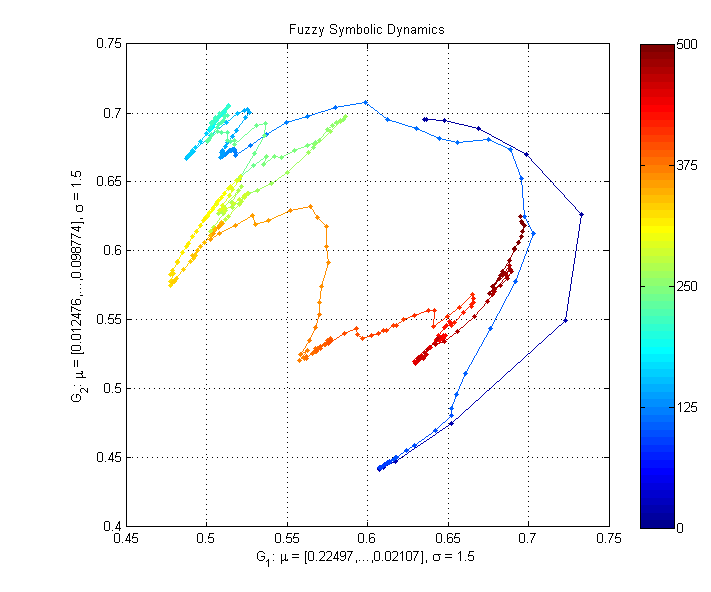
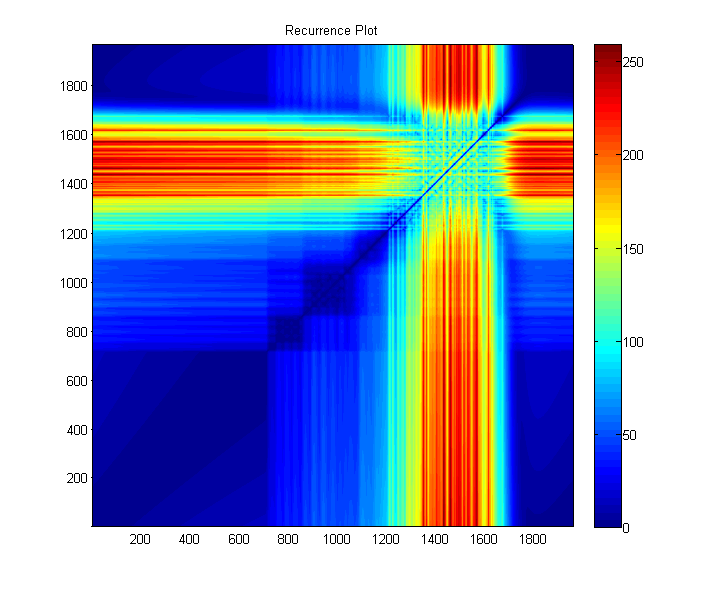
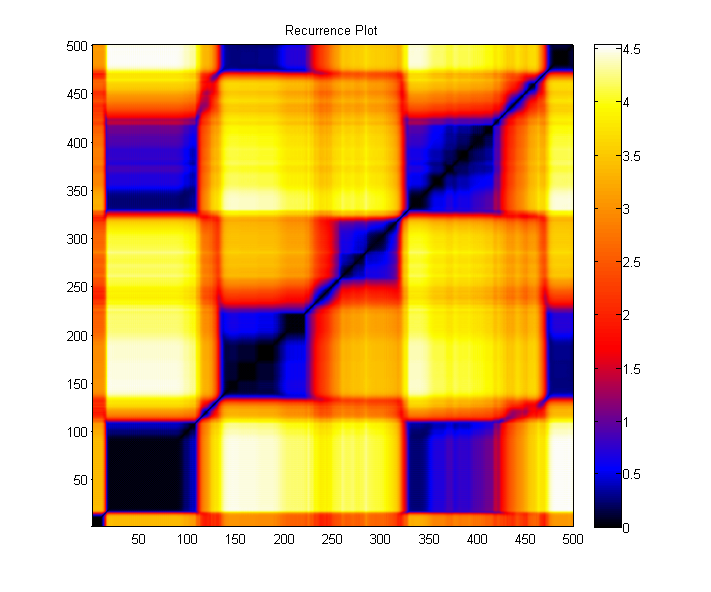
Sliding Attractor in Autistic Cyclic Movements Model
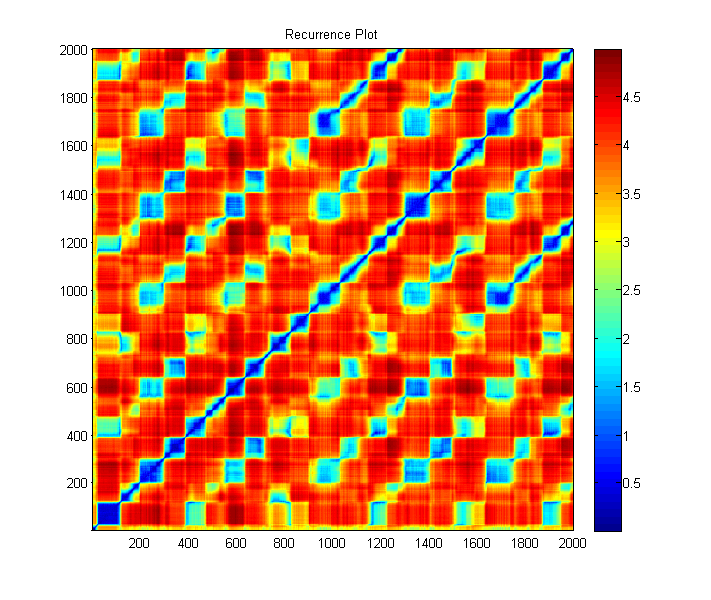
Epileptic EEG data

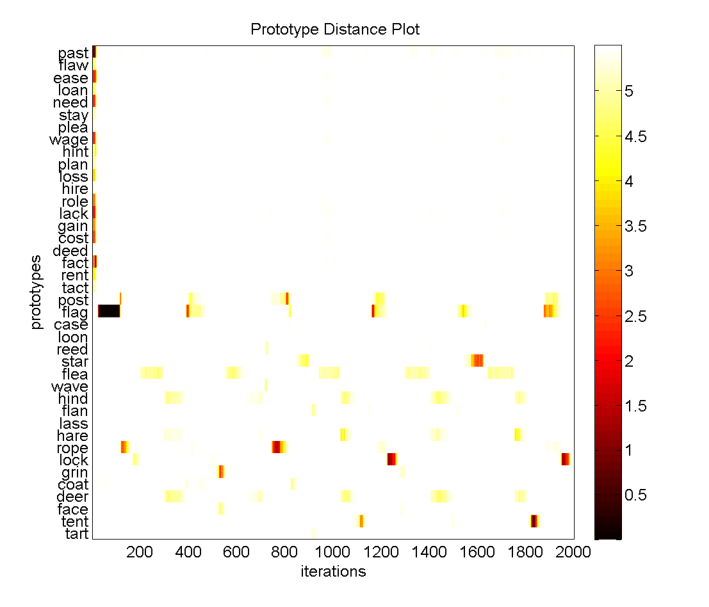
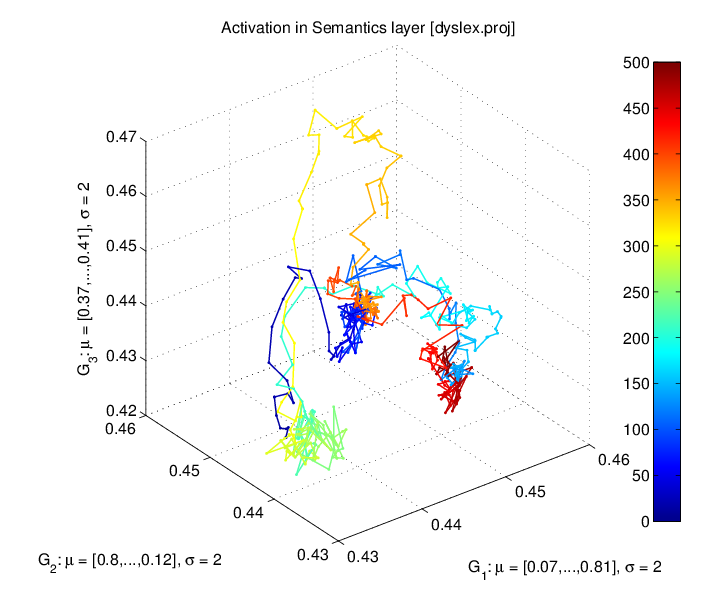
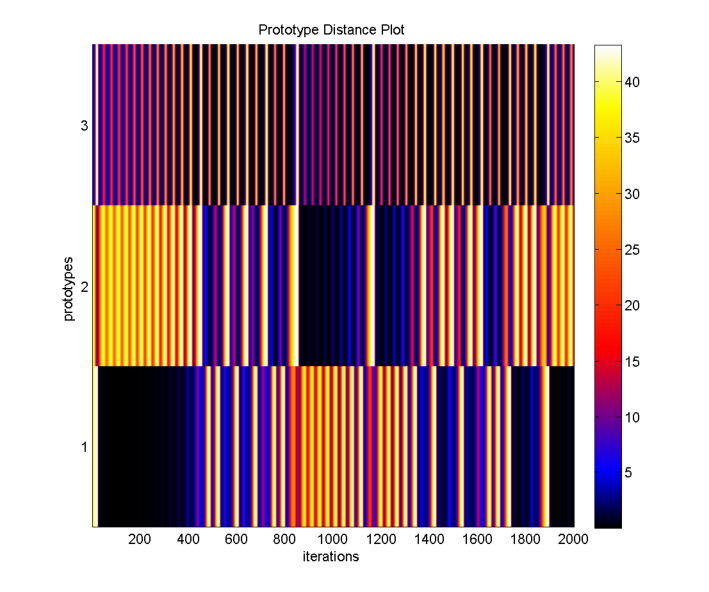
PDP for Dyslexia Model

PDP for Lorenz Attractor

Trajectory and prototypes of Dyslexia Model

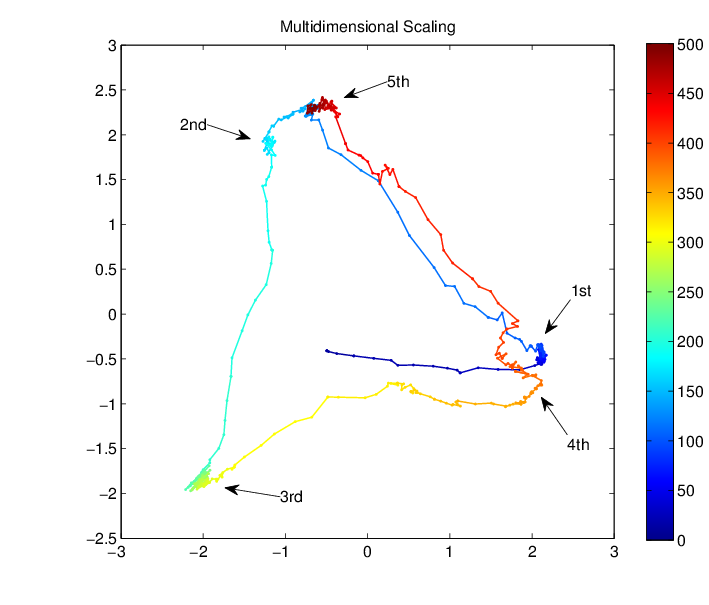
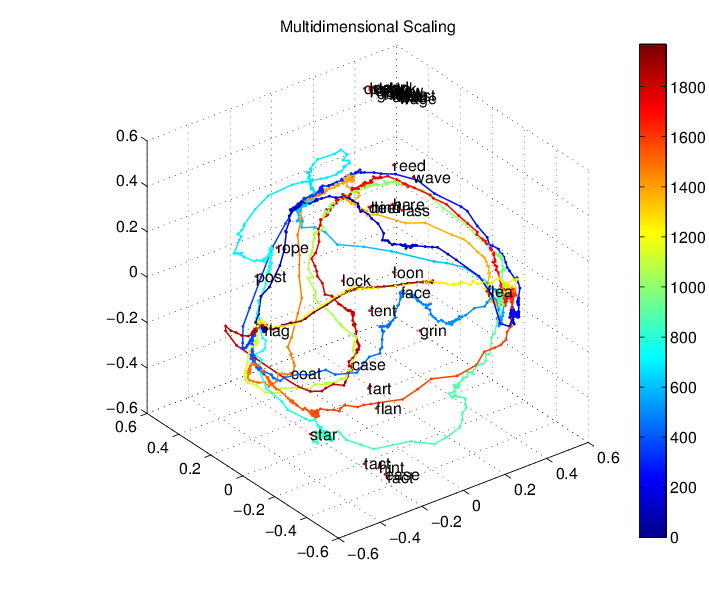
2D MDS for flag word in Dyslexia Model

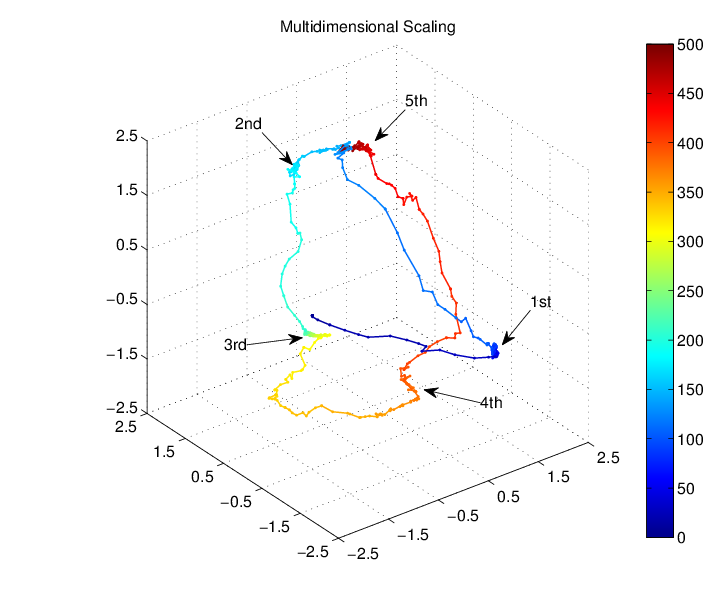
3D MDS for flag word in Dyslexia Model

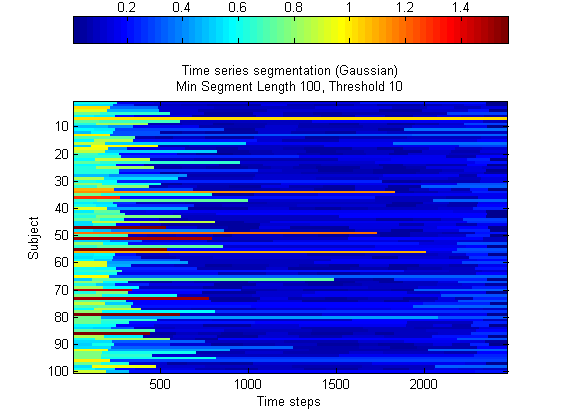
Segmentation Diagram

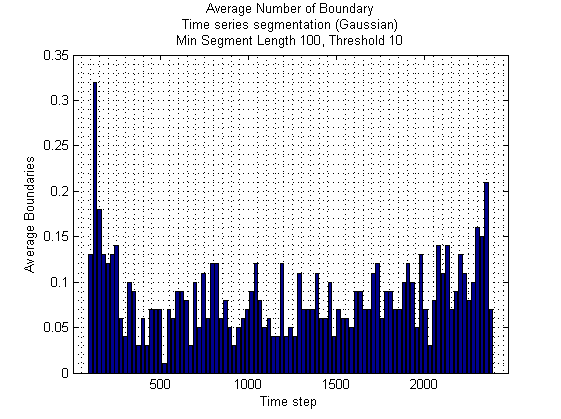
Average Number of Boundaries

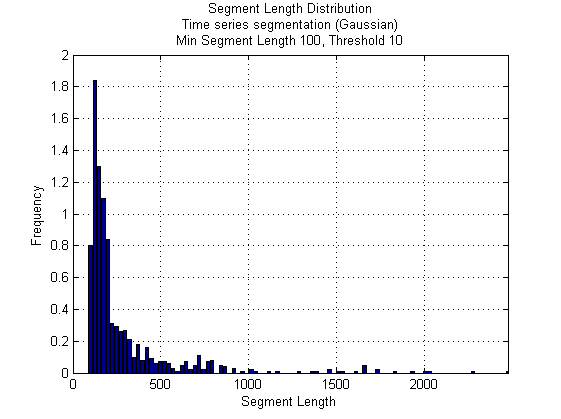
Segment Length Distribution

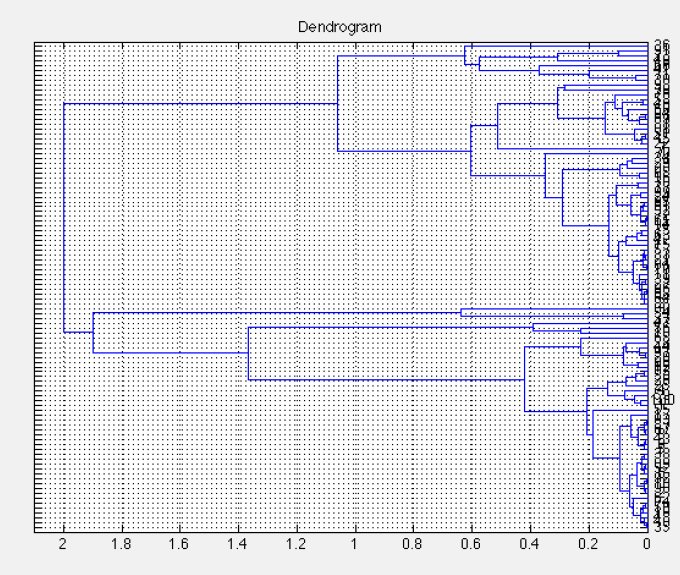
Clusterization Dendrogram

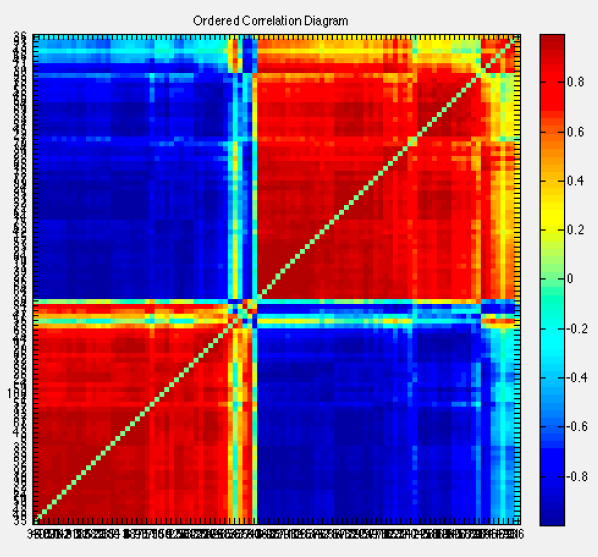
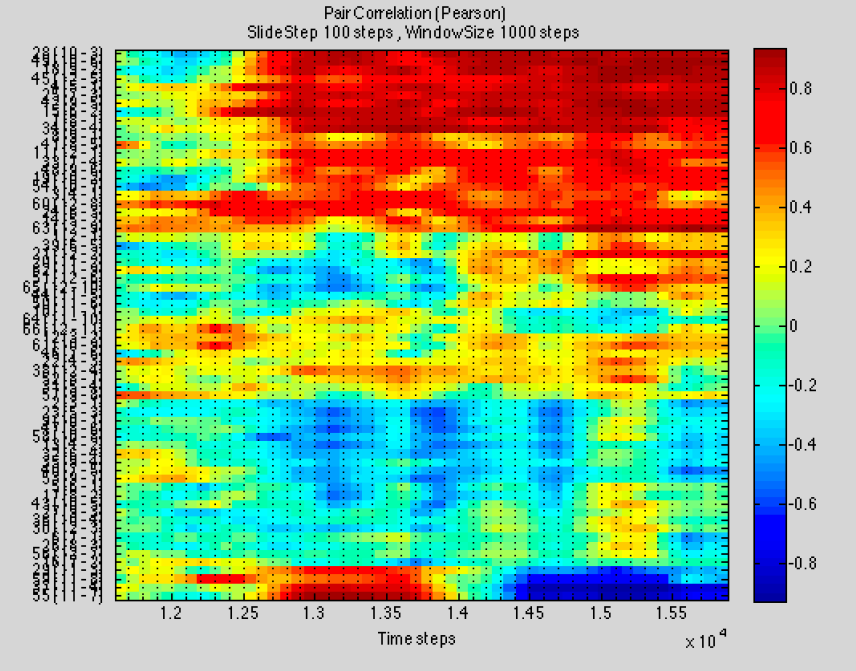
Ordered Correlation Diagram

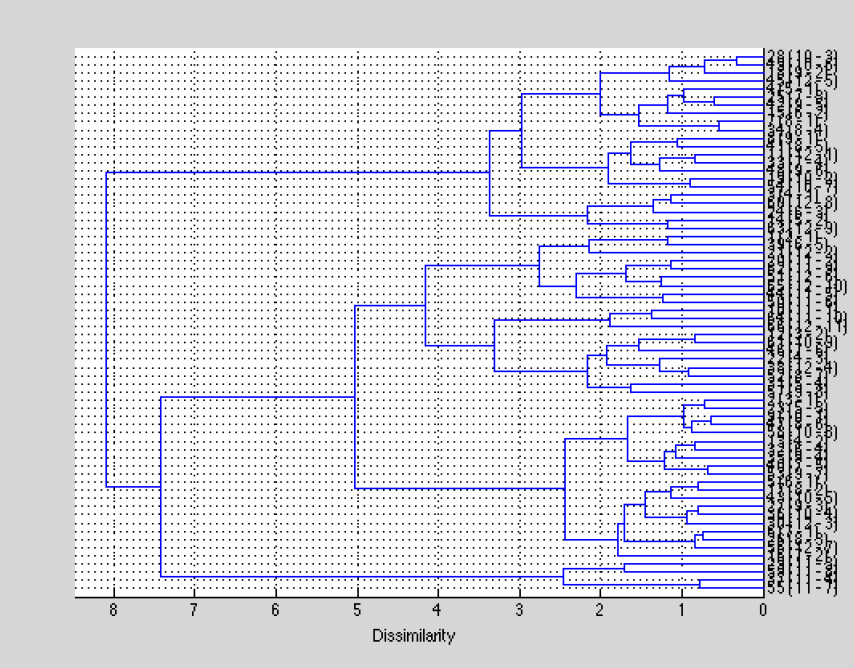
Pair Correlation Dendrogram

Pair Correlation Coefficient

Download


Runtime required for execution
Required
  • Install this if you don't have
    MATLAB installed on your system
  • VISER Toolbox requires R2013a (8.1) version of runtime libraries
Beta not fully tested
Developing
  • This is the latest beta release i.e. not recommended for most users ;)
  • Current beta version:
    0.9.33b

Sample data

Additionally you can download a sample data pack that will allow to reconstruct most of the above examples:   Sample-Data-Pack.zip

Documentation


Manual

You can download the latest manual for VISER Toolbox at this link: in preparation.

Papers

Below you can find some useful papers covering the topic of methods implemented in VISER toolbox:

Links

Some helpful links:

Recurrence Plots and Cross Recurrence Plots by N. Marwan:
http://recurrence-plot.tk
ICALAB – Toolbox for ICA, BSS and BSE by A. Cichocki et al.:
http://www.bsp.brain.riken.jp/ICALAB/ICALABImageProc

Our Team


Krzysztof Dobosz

Developer & Designer

Core application development, visualization module, webpage.

Włodzisław Duch

Supervisor

Supervision of visualization techniques.

Chong Eu Lee

Developer

Segmantation and clusterization module implementation.

Siew Ann Cheong

Supervisor

Supervision of segmantation and clusterization techniques.

Contact Details


Affiliation

Department of Informatics
Faculty of Physics, Astronomy & Informatics
Nicolaus Copernicus University
Grudziądzka 5, 87-100 Toruń, Poland
Division of Physics and Applied Physics
School of Physical & Mathematical Sciences
Nanyang Technological University
21 Nanyang Link, Singapore 637371

Quick Contact

Please send an email to or use the form below to contact us: